Overall Results
Contents
We performed various experiments by varying the pretraining dataset, type of optimizer used, target labeling scheme, training data size, type of CNN architecture etc. During the course of this research, we ended up 339 working models. In this section we will compare and contrast the performance of our supervised models with SimCLR-S2 models. Table 1 below gives a split up of our experiments
| Experiment description | Experiment type | Total Number |
|---|---|---|
| baseline | supervised | 120 |
| pretrain | SimCLR-S2 | 3 |
| finetune | SimCLR-S2 | 36 |
| distill | SimCLR-S2 | 180 |
| total experiments | all | 339 |
SimCLR-S2 vs Baseline
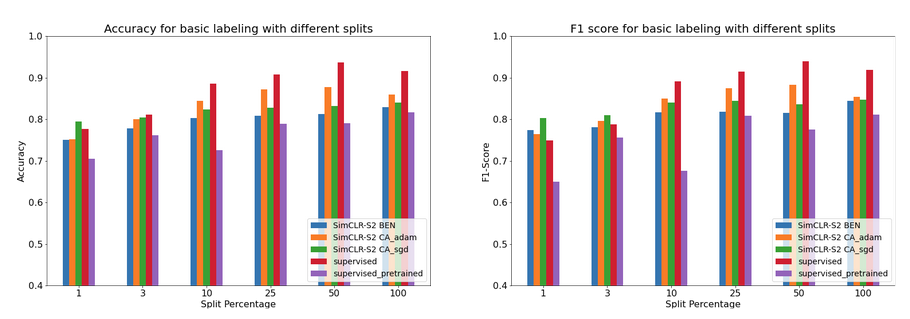
The following visualizations show how the SimCLR-S2 model performed compared to the baseline models. The comparison represents the average scores among each architecture for the baseline models as well as the average scores across each distill architecture and pretrained model for the SimCLR-S2 models. When using a small fraction of data the SimCLR-S2 model appears to outperform the baseline.
Score:
Figure 2 shows the same results but with the expanded labels. Interestingly, the SimCLR-S2 model did not seem to perform as well as it had when trained with the basic labels. The SimCLR-S2 model only outperformed the baseline when looking at the accuracy score on 1 percent labeled data. The F1 and AUC scores were better for the baseline across the board.
While the baseline seems to perform better on the expanded labels, the difference is much smaller than was seen in the results for basic labels. Many of models trained with the 1 and 3 percent labels exhibited a wide variance in model performance. For example, F1 scores ranged from 0 to 0.82. This is likely due to the random state in each model as it was trained. Further experimentation with an average over multiple training runs may have produced more consistent baseline results for which to compare. The SimCLR-S2 models did not exhibit the same problem with the small amount of labels.
Score:
Baseline Results
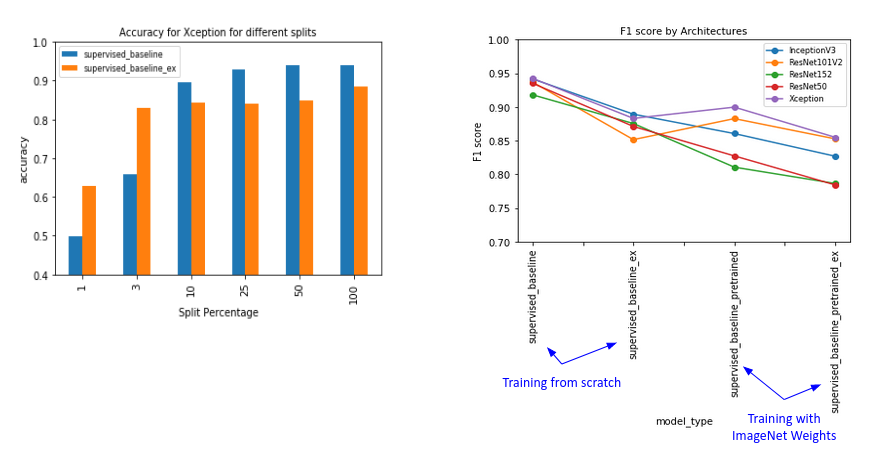
Our baseline results showed that performance improved with size of training data. Initially, each time the data size tripled, accuracy improved by 33%. As expected, these gains plateaued after a certain point. When we increased the training data size by a hundred fold, we saw an accuracy of 0.93. Our results indicated that the F1 score was better for smaller CNN architectures. Inceptionv3 and Xception with roughly 23 million parameters, gave the highest F1-scores at 0.94, while ResNet152 had a F1-score of 0.91. Training from scratch gave us better F1-scores than training using ImageNet weights. This is probably because ImageNet weights were only available for the visible bands of light, while we use all the available multispectral bands for training from scratch.

Figure 3: Accuracy and F1 scores for supervised baseline
SimCLR-S2 Finetune Results
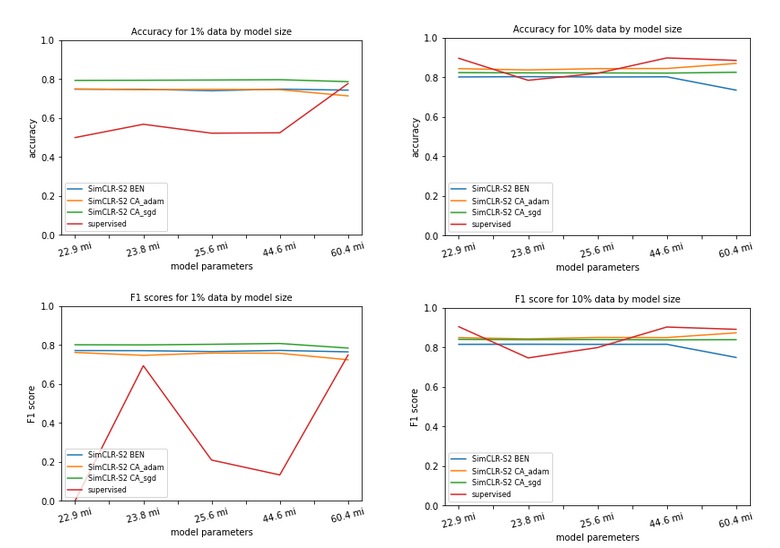
The results from our experiments showed that the SimCLR-S2 models outperformed the supervised baseline for smaller samples. For 1-3% of data splits, the accuracy and F1 scores were better or on par with that of the supervised learning. As the data size increased, the model performance dropped to below that of the supervised baselines. Our SimCLR-S2 models consistently out performed the supervised model that was pretrained with ImageNet weights.

Figure 4: SimCLR-S2 Fine tune performance for various models
SimCLR-S2 Distillation Results
The last and final step in our SimCLR-S2 paradigm is the process of distillation to a student model. We took each ResNet152 model finetuned across the various data splits and performed distill learning to our five model architectures. We found that even for the smallest model Xception, with 22.9 million parameters, there was improved F1 scores for data splits from 3% and above, and with larger models accuracy over the fine-tuned teacher model increased across the board. We suspect that the freezing of the convolutional layers during the fine tuning process resulted in their poorer performance compared to the student models, which had all layers enabled for distill learning. Distillation scores were better than those of supervised baselines for smaller data sizes on many architectures. For the 1% data split, SimCLR-S2 outperformed the baseline across the board. For 3 and 10% data splits there were some architectures where SimCLR-S2 performed better than supervised. Supervised baseline gave better performance than SimCLR-S2 on higher data splits.

Figure 5: Comparison of SimCLR-S2 distillation performance scores with baseline scores
Other Observations
A distribution of our performance scores across all of our models showed that the SimCLR-S2 models brought the f1, accuracy and AUC scores closer together across different data sizes and CNN architectures. The variability of these scores were much higher with supervised learning. All of our SimCLR-S2 models had an AUC score higher than 0.72, independent of training data or model sizes. The mean AUC score across all SimCLR-S2 models was around 0.83 indicating that SimCLR-S2 models were effective in detecting permanently irrigated land. Supervised learning on the other hand, had models with AUC scores as low as 0.5. We also observed that the mean f1 score between SimCLR-S2 and supervised models was the same.

Figure 6: Distribution of performance scores for SimCLR-S2 and supervised models
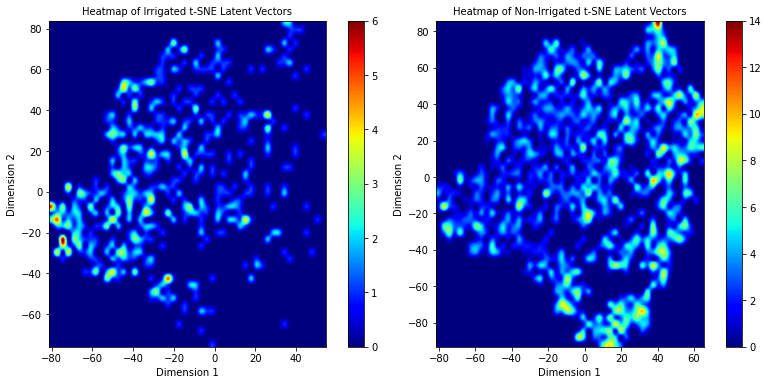
The t-SNE heat map of our SimCLR-S2 pretraining model shows clear indication of dense zones of clustering in both irrigated and non-irrigated classes. We believe that training the models for longer than 50 epochs could potentially help with further separation of these clusters.

Figure 7: t-SNE heatmaps of our pretrained model trained on BigEarthNet-S2 data